Test Result Reporting and Failing Fast in CI Pipelines

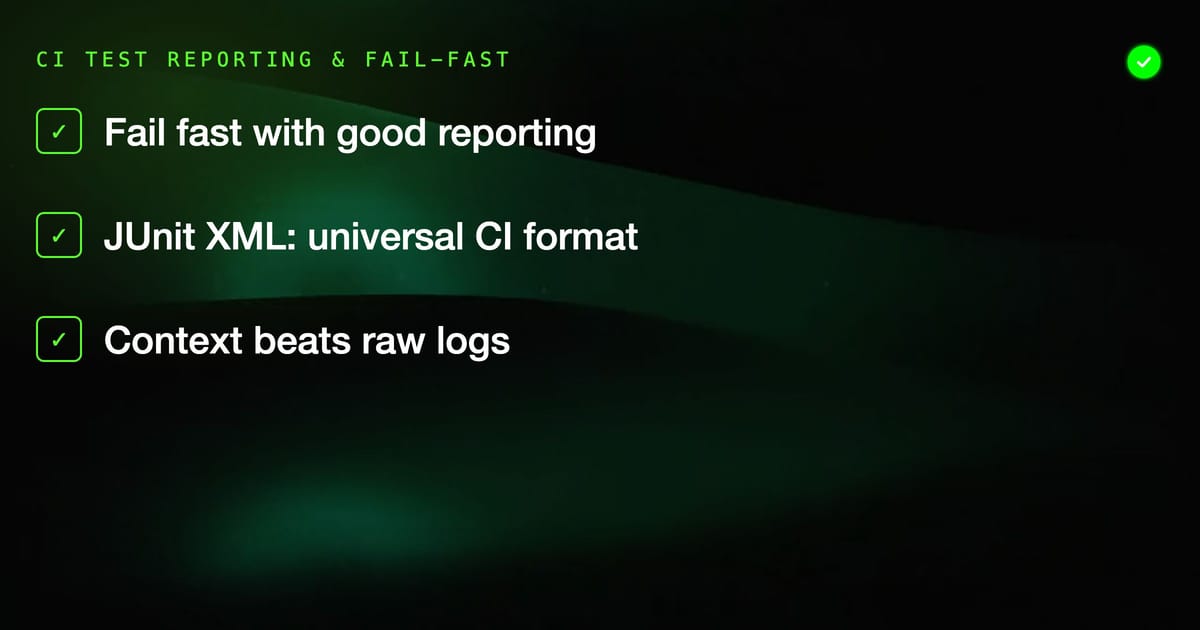
A test failure that takes 20 minutes to surface, buries the error in 3000 lines of log output, and gives no context about what changed is nearly useless. Good test reporting transforms raw pass/fail data into actionable signals. Failing fast — stopping the pipeline the moment you have enough information to make a decision — keeps feedback loops tight and respects developer time.
These two concerns are deeply connected: you can only fail fast confidently when your reporting is good enough that a fast failure still gives you everything you need to fix the problem.
What Good Test Reporting Looks Like
Before discussing implementation, it's worth being precise about what "good" means here:
- Immediate visibility — failures are surfaced at the PR/commit level, not buried in logs
- Failure context — what failed, with what input, producing what output, and in which file/line
- Historical comparison — is this a new failure or a pre-existing one?
- Trend data — is this test getting flakier? Is the suite getting slower?
- Actionability — the report points to a fix, not just a symptom
Most teams get #1 and stop. The teams that nail all five have fundamentally different debugging velocity.
JUnit XML: The Universal Format
JUnit XML is the lingua franca of CI test reporting. Almost every test framework can emit it, and almost every CI platform can ingest it. Understanding the format helps you produce better reports.
<?xml version="1.0" encoding="UTF-8"?>
<testsuites name="My Test Suite" tests="42" failures="2" errors="0" time="8.432">
  <testsuite name="UserService" tests="15" failures="1" time="2.1">
    <testcase name="should create user with valid email" classname="UserService" time="0.234">
      <!-- Empty = passed -->
    </testcase>
    <testcase name="should reject duplicate email" classname="UserService" time="0.089">
      <failure message="Expected 409, got 200" type="AssertionError">
        Expected status code 409 but received 200

        Request: POST /api/users
        Body: {"email": "existing@example.com"}

        at UserService.test.js:47:5
        at Object.<anonymous> (UserService.test.js:44:3)
      </failure>
    </testcase>
  </testsuite>
</testsuites>The failure element's content is what gets displayed in CI UIs. Invest in making it descriptive. Compare these two failure messages:
Bad:  "AssertionError: expected 404 to equal 200"
Good: "POST /api/users/999 returned 404 Not Found. Expected 200 OK. User ID 999 does not exist in test database — check test setup in beforeAll()"The second message often eliminates the need to read logs at all.
Configuring Test Reporters
Jest
// jest.config.js
module.exports = {
  reporters: [
    'default',  // Console output during test run
    ['jest-junit', {
      outputDirectory: 'test-results',
      outputName: 'junit.xml',
      classNameTemplate: '{classname}',
      titleTemplate: '{title}',
      ancestorSeparator: ' › ',
      usePathForSuiteName: true,
    }],
    ['jest-html-reporters', {
      publicPath: './test-results',
      filename: 'report.html',
      openReport: false,
      includeFailureMsg: true,
      includeConsoleLog: true,
    }],
  ],
};For richer failure context, customize your test assertions:
// Better assertion messages
expect(response.status).toBe(200); // Poor: "Expected 404, received 200"

expect(response.status).toBe(200); // Better with custom message:
expect(response.status,
  `POST ${path} failed with ${response.status}: ${JSON.stringify(response.body)}`
).toBe(200);

// Or use a helper
function assertStatus(response, expected) {
  expect(response.status).toBe(expected,
    `Expected ${expected}, got ${response.status} ${response.statusText}\n` +
    `URL: ${response.url}\n` +
    `Body: ${JSON.stringify(response.body, null, 2)}`
  );
}Pytest
# pytest.ini
[pytest]
addopts =
    --junit-xml=test-results/junit.xml
    --junit-logging=all
    -v
--tb=short# conftest.py — add custom metadata to reports
import pytest
def pytest_runtest_makereport(item, call):
"""Add extra context to failure reports."""
if call.when == "call" and call.excinfo:
# Attach any fixtures' state to the failure
if hasattr(item, 'funcargs'):
for name, value in item.funcargs.items():
if hasattr(value, '__dict__'):
item.add_report_section(
'call',
f'Fixture state: {name}',
str(value.__dict__)
)# Use pytest-html for rich HTML reports
# pip install pytest-html
# pytest.ini
addopts = --html=test-results/report.html --self-contained-htmlGo
# go test produces output but not JUnit by default
# Use gotestsum for JUnit output + better formatting
go install gotest.tools/gotestsum@latest

gotestsum --junitfile test-results/junit.xml --format testname ./...// For richer failure messages in Go, use testify
import "github.com/stretchr/testify/assert"
func TestUserCreation(t *testing.T) {
user, err := CreateUser("test@example.com")
// Bad: "Not equal: expected 1, got 0"
assert.Equal(t, 1, user.ID)
// Better: includes context automatically
assert.NoError(t, err, "CreateUser should not return an error for valid email")
assert.NotZero(t, user.ID, "Created user should have a non-zero ID")
}Platform-Specific Reporting Integration
GitHub Actions
- name: Run tests
  run: npm test -- --reporters=jest-junit

- name: Publish test results
  uses: dorny/test-reporter@v1
  if: always()  # Run even if tests failed
  with:
    name: Jest Test Results
    path: test-results/junit.xml
    reporter: jest-junit
fail-on-error: trueThe if: always() is critical — you want the report even (especially) when tests fail.
For annotating individual lines in PRs with failures:
- name: Annotate test failures
  if: failure()
  uses: mikepenz/action-junit-report@v4
  with:
    report_paths: 'test-results/**/*.xml'
    include_passed: false
annotate_only: falseThis creates inline PR annotations pointing to the exact file and line where each test failed.
GitLab CI
unit-tests:
  script:
    - npm test -- --reporters=jest-junit
  artifacts:
    when: always
    reports:
      junit: test-results/junit.xml
    paths:
      - test-results/
      - coverage/
    expire_in: 30 days
coverage: '/All files[^|]*\|[^|]*\s+([\d\.]+)/'GitLab's native JUnit support shows test results directly in the merge request UI, including a diff view showing which tests are new failures vs. pre-existing.
Jenkins
post {
    always {
        junit(
            testResults: 'test-results/**/*.xml',
            allowEmptyResults: true,
            keepLongStdio: true
        )

        publishHTML([
            reportDir: 'test-results',
            reportFiles: 'report.html',
            reportName: 'Test Report',
            keepAll: true,
            alwaysLinkToLastBuild: false,
        ])

        // Trend analysis across builds
        perfReport(
            sourceDataFiles: 'test-results/junit.xml',
            modePerformancePerTestCase: true
        )
    }
}Fail-Fast Strategies
Failing fast means stopping as soon as you have sufficient signal that the build should not proceed. The key word is "sufficient" — stopping too early wastes information; stopping too late wastes time.
Stage-Level Fail-Fast
The most basic form: don't run slow stages if fast stages fail.
# GitHub Actions — jobs depend on each other
jobs:
  lint:
    runs-on: ubuntu-latest
    steps:
      - run: npm run lint

  unit-tests:
    needs: lint  # Only runs if lint passes
    runs-on: ubuntu-latest
    steps:
      - run: npm test:unit

  integration-tests:
    needs: unit-tests  # Only runs if unit tests pass
    runs-on: ubuntu-latest
    steps:
- run: npm test:integration# GitLab CI — stages enforce ordering
stages:
- lint
- unit
- integration
- e2e
# Jobs in 'unit' stage only run if 'lint' stage passes
# Jobs in 'integration' stage only run if 'unit' stage passesTest-Level Fail-Fast (Bail)
Stop running tests within a suite after the first N failures:
# Jest — stop after first failure
npx jest --bail=1

# Or after 3 failures (useful for flaky test detection)
npx jest --bail=3

# Pytest
pytest --maxfail=1 tests/

# Go
go test -failfast ./...The tradeoff: --bail=1 gives fastest feedback on catastrophic failures (like a missing import or broken test setup) but gives you less information when multiple independent tests fail. --bail=5 is often a better default — it catches cascading failures while still collecting enough data to work from.
Conditional Fail-Fast Based on Changed Files
For large monorepos, run only tests related to changed files:
// scripts/get-affected-tests.js
const { execSync } = require('child_process');

const changedFiles = execSync('git diff --name-only origin/main...HEAD')
  .toString()
  .split('\n')
  .filter(Boolean);

const testPatterns = new Set();

for (const file of changedFiles) {
  if (file.startsWith('src/auth/')) {
    testPatterns.add('auth');
  }
  if (file.startsWith('src/payments/')) {
    testPatterns.add('payments');
  }
  if (file.startsWith('src/')) {
    // Any src change runs the full unit suite
    testPatterns.add('unit');
  }
}

// Output as Jest --testPathPattern
console.log([...testPatterns].join('|'));- name: Get affected test patterns
id: affected
run: echo "pattern=$(node scripts/get-affected-tests.js)" >> $GITHUB_OUTPUT
- name: Run affected tests
run: npx jest --testPathPattern="${{ steps.affected.outputs.pattern }}"Timeout-Based Fail-Fast
A test that hangs indefinitely is worse than a test that fails — it blocks the pipeline and provides no information.
// jest.config.js
module.exports = {
  testTimeout: 10000,  // 10 seconds per test

  // For entire suite
  globals: {
    __TEST_TIMEOUT__: 30000,
  }
};# GitHub Actions — job-level timeout
jobs:
test:
runs-on: ubuntu-latest
timeout-minutes: 15 # Kill the job if it takes more than 15 minutes# pytest timeout per test
# pip install pytest-timeout
@pytest.mark.timeout(30)
def test_slow_operation():
# Will fail if it takes more than 30 seconds
result = slow_api_call()
assert result is not NoneFlaky Test Detection and Reporting
Flaky tests undermine trust in your entire test suite. Detecting them requires tracking failure rates over time, not just current state.
# Run failed tests multiple times to detect flakiness
- name: Run tests with retry
  run: npx jest --reporter=jest-junit --retries=2

# If a test passes on retry, mark it as flaky (not failed) in the reportA more systematic approach uses test history:
// scripts/detect-flaky.js
// Compare this run's results with the last 10 runs
// Tests that fail < 100% of the time are flaky candidates

const currentResults = parseJUnit('./test-results/junit.xml');
const historicalResults = loadHistory('./test-history/');

const flaky = currentResults.failures.filter(failure => {
  const history = historicalResults[failure.name] || [];
  const failureRate = history.filter(r => r === 'fail').length / history.length;
  return failureRate < 1.0 && failureRate > 0;
});

if (flaky.length > 0) {
  console.warn(`Potentially flaky tests detected:\n${flaky.map(t => `  - ${t.name}`).join('\n')}`);
  // Don't fail the build for flaky tests — but do report them
}Building a Test Health Dashboard
Beyond individual run reports, tracking metrics over time reveals trends that single-run reports miss.
Key metrics to track:
// After each CI run, emit metrics to your monitoring system
const metrics = {
  total_tests: results.total,
  passed: results.passed,
  failed: results.failed,
  skipped: results.skipped,
  duration_seconds: results.duration,
  slowest_test: results.slowestTest,
  flaky_tests: results.flaky.length,
  branch: process.env.GITHUB_REF,
  commit: process.env.GITHUB_SHA,
  timestamp: new Date().toISOString(),
};

// Push to your analytics backend
await fetch(process.env.METRICS_ENDPOINT, {
  method: 'POST',
  headers: { 'Content-Type': 'application/json' },
  body: JSON.stringify(metrics),
});The most valuable trend to watch: test suite duration over time. A test suite that grows 10% slower every month will become a problem within a year. Catching this trend early — before it becomes a crisis — lets you address it incrementally rather than with a painful "fix the test suite" sprint.
Good test reporting isn't a CI configuration task you do once — it's an ongoing investment that pays off every time someone can diagnose and fix a test failure in 5 minutes instead of 50.