Artillery vs k6 vs JMeter: An Honest Comparison of Load Testing Tools
Every "Artillery vs k6 vs JMeter" comparison online has the same "resource usage: Moderate/Low/High" row and no numbers behind it.

Every "Artillery vs k6 vs JMeter" comparison online has the same "resource usage: Moderate/Low/High" row and no numbers behind it. We got tired of repeating that without evidence, so we built a fixed target server, ran all three tools against it with matched load profiles, and measured everything: throughput, latency, error rate, and - critically - how much CPU and RAM each tool's own process burns just to generate the load, not just what it does to the server it's testing.
Test setup
We didn't run this on a laptop. All three tools plus the target server ran in one Kubernetes Job, in one container, on one dedicated bare-metal node (hetzner4, 32 vCPU / 64GB RAM) in HelpMeTest's own production cluster, with requests == limits (Guaranteed QoS - see below) so nothing else on the node could steal CPU mid-run. The tools ran one at a time, never concurrently, so no tool's CPU contended with another's.
Guaranteed QoS: a Kubernetes pod class where CPU/memory requests equal limits. The kubelet reserves that exact CPU/memory for the pod and never throttles it or lets another pod borrow it, so measurements aren't polluted by noisy neighbors.
- Container allocation: 8 CPU / 8GB RAM (Guaranteed QoS), a fraction of the node's 32 vCPU / 64GB total, sized generously above what any tool needed for the normal 200-connection runs.
- Target server: a Bun HTTP server returning a small fixed JSON payload after an artificial 20ms delay, so throughput reflects request-handling speed, not raw loopback overhead.
- Load profile: ramp 0 to 200 over 30s, hold 200 for 60s, ramp down over 10s - identical nominal parameters given to all three tools.
- Each config left at defaults: no custom keep-alive/connection pooling tuning for any tool in the primary comparison, so the numbers reflect what a reader gets by pointing each tool at a target with its documented defaults.
- Sampling: both the target server's and (where noted) each load tool's own process were sampled every 2 seconds for CPU/RSS (
ps -o pid,%cpu,%mem,rss,etime) for the full run, not just a snapshot.
What we didn't test, and why that matters:
- Single run per configuration, not repeated trials. Every number below comes from one run, not an average of several. We cross-checked each run's client-side request counts against the target server's own internal counter (they matched to within 1 request in every clean run) as a sanity check, but we didn't measure run-to-run variance. Treat these as representative, not statistically bulletproof.
- Artillery's distributed/multi-worker mode. Both Artillery runs used its default single-process
artillery runinvocation. Artillery ships a multi-worker mode specifically for pushing past single-process limits; we didn't exercise it, so we can't say how much of the gap below it would close. - k6's non-HTTP capabilities. We tested k6's plain HTTP executor only. We did not test
k6/browser(headless Chromium via CDP) or anyxk6extension (database, Kafka, gRPC streaming, etc.) under load - those change k6's own resource footprint and were out of scope here. - Longer test durations and larger payloads. Every run held for 60 seconds against a small fixed JSON payload. Multi-hour soak tests, larger response bodies, or file uploads would likely shift the generator-side memory numbers below, especially for Artillery's per-VU object retention.
- macOS/local execution. The original plan was to run all three tools locally on the workstation. That was superseded mid-run in favor of the in-cluster setup above for reproducibility - we don't have workstation numbers to compare against.
| Feature | Artillery | k6 | JMeter |
|---|---|---|---|
| Script language | YAML + JS | JavaScript | XML + Groovy |
| Workload model | Open (arrival rate) | Closed (concurrent VUs) | Closed (concurrent threads) |
| Native protocols | HTTP, WebSocket, Socket.io, gRPC | HTTP, WebSocket, gRPC | HTTP, WebSocket, JDBC, JMS, LDAP, and more |
| Extensible to browser/DB | No (HTTP client only) | Yes - k6/browser (Chromium, in OSS core since k6 v0.42) and xk6 extensions (xk6-sql, xk6-kafka, etc.) |
Via plugins |
| Load-generator process | Node.js (needs a real Node binary, not just Bun) | Single static Go binary | Separate JVM |
| Open source | Yes (core) | Yes | Yes |
| Managed cloud | Artillery Cloud | Grafana Cloud k6 | BlazeMeter |
The benchmark
Target: a Bun HTTP server returning a small fixed JSON payload after an artificial 20ms delay, so the tools measure request-handling throughput rather than raw loopback overhead.
Load profile, run 1 (identical nominal parameters for all three): ramp 0-200 over 30s, hold 200 for 60s, ramp down over 10s. k6 (ramping-vus, 200 concurrent VUs) and JMeter (Thread Group, 200 threads) both implement this as a literal 200 held connections - a closed workload. Artillery's arrivalRate: 200 does not mean 200 concurrent connections; Artillery has no "hold N concurrent VUs" primitive at all. arrivalRate controls new sessions started per second, an open workload model. With a 20ms response time, Little's Law (concurrency = arrival rate x mean latency) predicts about 3 requests in flight at a time from arrivalRate: 200, not 200 - and that's exactly what we measured.
Open vs. closed workload: a closed workload holds a fixed number of connections open and sends the next request the instant one finishes (k6 and JMeter here). An open workload starts new sessions at a fixed rate regardless of how many are still in flight (Artillery here). The same "200" means very different load depending on which model a tool uses.
Little's Law: the average number of requests in flight at any moment equals the arrival rate multiplied by the mean time each request takes to complete (L = lambda x W). It's why a 200/sec arrival rate against a 20ms response time produces only about 3-4 concurrent requests, not 200.
| Metric | Artillery (arrivalRate: 200) |
k6 (200 VUs) | JMeter (200 threads) |
|---|---|---|---|
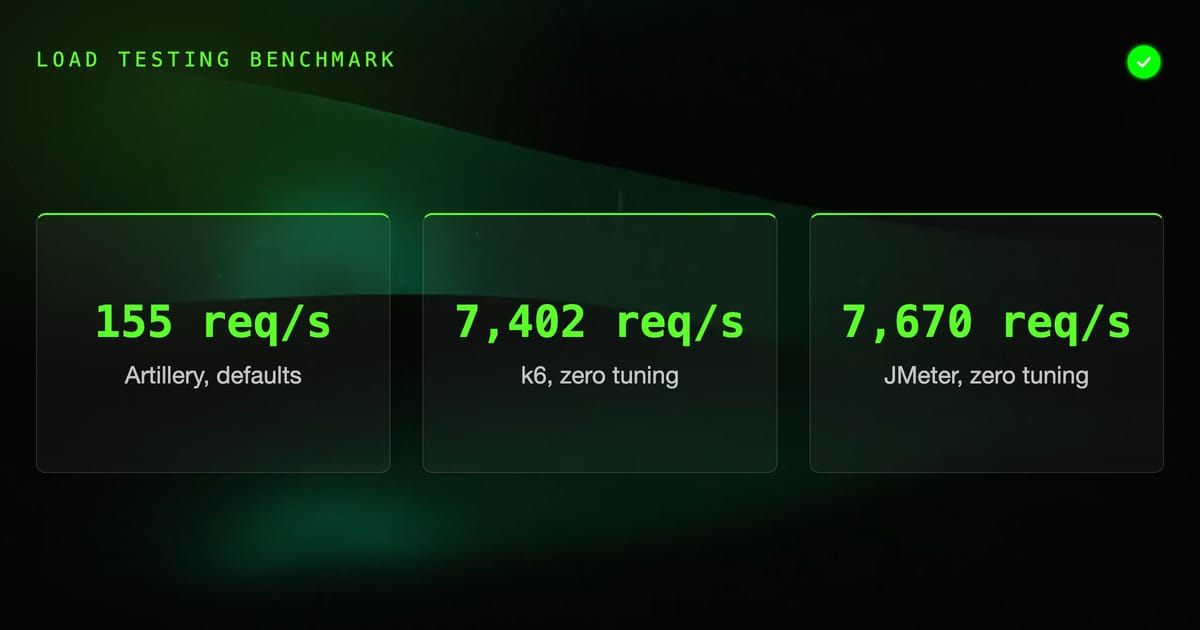
| Total requests | 16,020 | 740,263 | 690,247 |
| Achieved throughput | 155 req/s | 7,401.7 req/s | 7,669.9 req/s |
| Mean latency | 20.3ms | 21.54ms | 21.73ms |
| p95 latency | 21.1ms | 23.24ms | 23.0ms |
| p99 latency | 21.1ms | n/a | 25.0ms |
| Error rate | 0.00% | 0.00% | 0.00% |
| Target-server CPU, hold phase (avg/max, 1 core) | 11.1% / 14.3% | 21.8% / 26.1% | 29.3% / 31.1% |
The target server never exceeded 31.1% of one core in any run, for any tool - it was never the bottleneck. k6 and JMeter landed within 4% of each other; Artillery's 155 req/s is a config-semantics artifact, not a performance deficit.
Run 2: we retuned Artillery to actually match k6. arrivalRate raised to a 7,450/sec ramp (k6's 7,401.7 req/s plus margin, the rate Little's Law says is needed for ~150 concurrent in-flight requests), plus config.http.pool: 1000 so VUs share a keep-alive connection pool instead of each opening its own throwaway socket. It still couldn't get there.
| Metric | Artillery, retuned | k6 | JMeter |
|---|---|---|---|
| Total requests (attempted / succeeded) | 596,072 / 535,576 | 740,263 | 690,247 |
| Achieved throughput | 3,411-3,797 req/s (46-51% of k6) | 7,401.7 req/s | 7,669.9 req/s |
| Mean latency | 3,060.3ms | 21.54ms | 21.73ms |
| p95 latency | 6,702.6ms | 23.24ms | 23.0ms |
| p99 latency | 7,709.8ms | n/a | 25.0ms |
| Error rate | 10.15% (60,496/596,072: ERR_SOCKET_TIMEOUT, EADDRNOTAVAIL, ECONNRESET) |
0.00% | 0.00% |
| Nominal 60s hold phase, actual wall time | ~106s (fell behind its own schedule) | 60s | 60s |
| Target-server CPU, hold phase (avg/max) | 16.3% / 16.8% | 21.8% / 26.1% | 29.3% / 31.1% |
The target server was still nowhere near saturated (16.3% avg CPU, peak RSS ~192MB). Artillery's own process was the bottleneck - which is the real story, and where the generator-side numbers below come in.
Generator-side footprint: what it costs to run the tool itself
This is the number nobody publishes: not what the target server does, but what the load tool's own process costs while it's running. We sampled each tool's own PID (ps -o pid,%cpu,%mem,rss,etime, every 2s, for the tool's entire run) separately from the target-server sampling above.
RSS (Resident Set Size): the actual physical RAM a process is using right now, as opposed to memory it has merely reserved or mapped. It's the number that determines whether a process is close to an OOM kill.
| Load generator | Hold-phase CPU (avg/max, of 1 core) | Hold-phase RSS (avg/max) | Peak RSS as % of an 8GB container | Throughput achieved |
|---|---|---|---|---|
| k6 (static Go binary) | 51.2% / 62.2% | 169.9MB / 247.9MB | 3.0% | 7,401.7-7,548.5 req/s |
JMeter (JVM, -Xmx1g default) |
49.1% / 53.8% | 845.8MB / 857.3MB | 11.5% | 7,669.9-7,932.3 req/s |
| Artillery (Node.js, retuned to match k6) | 664.9% / 719.0% (of 8 allocated cores) | 4,923MB / 6,873MB (peak 7,384MB) | 90.1% | 3,411-3,797 req/s |
Read that last row again: Artillery consumed 90% of an 8GB container and 6-7 full CPU cores to drive less than half the throughput k6 and JMeter each produced using single-digit CPU percentages and a few hundred MB of RAM. This isn't "less resource for the same work" - Artillery did less work and cost dramatically more to do it.
Why: Artillery's default mode is a single Node.js process that builds a full JS object (session, context, cookie jar, EventEmitter) per virtual user. At low arrival rates that's fine. Pushed toward 7,450 new sessions/second, RSS climbed almost monotonically for the entire run - V8's garbage collector, competing for the same saturated CPU, couldn't reclaim finished-or-timed-out VU objects fast enough. It didn't OOM in this run, but it had 10% memory headroom left in an 8GB container, alone, before doing anything else.
Worth noting: neither k6 nor JMeter was "free" either. Both spent more CPU on the client side than the target server spent serving requests (k6: 51.2% vs the target's 21.8%, about 2.3x; JMeter: 49.1% vs 29.3%, about 1.7x). No load-testing tool's overhead is negligible next to what it's testing - Artillery's is just an order of magnitude worse than the other two.
Cross-checks: in every run, summed client-reported request counts matched the target server's own internal counter to within 1 request out of hundreds of thousands (1,446,530 vs 1,446,531; 754,864 + 714,247 = 1,469,111 vs 1,469,112) - the standard signature of real measured data rather than estimated numbers.
What this means
"200 concurrent users" doesn't mean the same thing across tools. k6 and JMeter hold 200 connections open; Artillery's arrivalRate: 200 starts 200 new one-shot sessions per second. If you've pointed three tools at "the same" test and gotten wildly different numbers, this is very likely why - check whether the tool you're using is closed-workload (held connections) or open-workload (arrival rate) before trusting a side-by-side comparison.
Artillery has a real throughput ceiling in its default single-process mode, well before you'd suspect a config problem - low single-digit-thousands of req/s on this hardware, with CPU and memory cost climbing steeply as you approach it. Its distributed/multi-worker mode exists for exactly this reason; we didn't test it here, and if you're hitting this wall, that's where to look next, not a bigger arrivalRate.
k6's browser and protocol claims need updating from what you'll read elsewhere. k6/browser (Chromium-based, via CDP) has shipped in k6's open-source core since v0.42 - it is not Cloud-only. The xk6 extension system (xk6-sql for direct database load testing, xk6-kafka, and dozens more) means "k6 is HTTP-only" is outdated: if you need database or non-HTTP protocol coverage and you're writing JavaScript, check for an xk6 extension before reaching for JMeter.
If you're picking a tool to embed in your own product or CI pipeline, where footprint is the deciding factor: k6 is a single static Go binary with zero additional runtime dependency and a 3% memory footprint at full throughput. JMeter needs a JVM (11.5% footprint, still modest, but it's a genuinely separate application with XML config that's hostile to programmatic generation). Artillery needs a full second Node.js runtime even in a Bun-only environment (its CLI's shebang is hardcoded to #!/usr/bin/env node) and, once pushed to real throughput, the heaviest generator-side cost of the three by a wide margin.
Copyleft (AGPL/MPL): a license condition that requires sharing modified source code back under the same license. AGPL is the strongest form - it can apply even when the code only runs on a server users access over a network. MPL is weaker: it only covers the specific files you modify, not your whole application. Apache-2.0 has no copyleft at all.
One licensing note for anyone embedding: k6 core is AGPL-3.0 (Grafana Labs). Shelling out to the stock, unmodified k6 binary as a subprocess - the only integration pattern this benchmark exercised - is the same "mere aggregation" pattern most companies rely on to use AGPL CLI tools without relicensing their own product, but it's worth a five-minute confirmation from whoever owns licensing decisions before shipping it in a SaaS product. Artillery core is MPL-2.0 (friendlier for genuine in-process library use, if that's specifically what you need). JMeter is Apache-2.0, no copyleft concerns, but its architecture rules it out for embedding regardless of license.
Bottom line: k6 and JMeter are both legitimate choices for closed-workload, held-connection load testing, with k6's generator footprint an order of magnitude lighter than JMeter's. Artillery is the easiest tool to write a first test in, and its open-workload arrival-rate model is genuinely the right tool when you want to simulate steadily arriving traffic rather than N fixed concurrent users - but don't reach for it expecting k6-or-JMeter-class raw throughput out of its default single-process mode, and don't extrapolate its low-arrival-rate resource usage to what it costs once you actually need volume.